Benchmarks
This page contains data from tests performed to evaluate the accuracy inStrain. In most cases similar tests were performed to compare inStrain’s accuracy to other leading tools. Most of these benchmarks are adapted from the inStrain publication where you can find more details on how they were performed.
Strain-level comparisons
This section contains a series of benchmarks evaluating the ability of inStrain to perform detailed strain-level comparisons. In all cases inStrain is benchmarked against three leading tools:
MIDAS - an integrated pipeline to estimate bacterial species abundance and strain-level genomic variation. Strain-level comparisons are based on consensus alleles called on whole genomes. The script strain_tracking.py was used for benchmarks.
StrainPhlAn - a tool for strain-level resolution of species across large sample sets, based on consensus single nucleotide polymorphisms (SNPs) called on species marker genes. Based on the MetaPhlAn2 db_v20 database.
dRep - a genome alignment program. dRep does not purport to have accuracy over 99.9% ANI and was just used for comparison purposes.
Benchmark with synthetic data
A straightforward in silico test. A randomly selected E. coli genome was downloaded and mutated to various chosen ANI levels using SNP Mutator. The original genome was compared to the mutated genome, and we looked for the difference between the actual ANI and the calculated ANI (the ANI reported by each program).
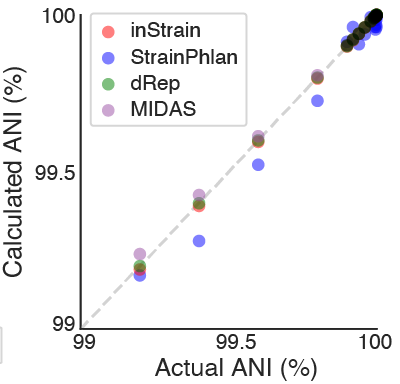
All four methods performed well on this test, although dRep, inStrain, and MIDAS had lower errors in the ANI calculation than StrainPhlAn overall (0.00001%, 0.002%, 0.006% and 0.03%, respectively; average discrepancy between the true and calculated ANI). This is likely because dRep, inStrain, and MIDAS compare positions from across the entire genome (99.99998%, 99.7%, and 85.8% of the genome, respectively) and StrainPhlAn does not (0.3% of the genome).
Methods for synthetic data benchmark:
For dRep, mutated genomes were compared to the reference genome using dRep on default settings. For inStrain, MIDAS, andStrainPhlAn, Illumina reads were simulated for all genomes at 20x coverage using pIRS.
For inStrain, synthetic reads were mapped back to the reference genome using Bowtie 2, profiled using “inStrain profile” under default settings, and compared using “inStrain compare” under default settings.
For StrainPhlAn, synthetic reads profiled with Metaphlan2, resulting marker genes were aligned using StrainPhlan, and the ANI of resulting nucleotide alignments was calculated using the class “Bio.Phylo.TreeConstruction.DistanceCalculator(‘identity’)” from the BioPython python package.
For MIDAS, synthetic reads were provided to the program directly using the “run_midas.py species” command, and compared using the “run_midas.py snps” command. The ANI of the resulting comparisons was calculated as “[mean(sample1_bases, sample2_bases) - count_either] / mean(sample1_bases, sample2_bases)”.
Benchmark with defined microbial communities

This test (schematic above) involved comparing real metagenomes derived from defined bacterial communities. The ZymoBIOMICS Microbial Community Standard, which contains cells from eight bacterial species at defined abundances, was divided into three aliquots and subjected to DNA extraction, library preparation, and metagenomic sequencing. The same community of 8 bacterial species was sequenced 3 times, so each program should report 100% ANI for all species comparisons. Deviations from this ideal either represent errors in sequence alignment, the presence of microdiversity consistent with maintenance of cultures in the laboratory, or inability of programs to handle errors and biases introduced during routine DNA extraction, library preparation, and sequencing with Illumina).
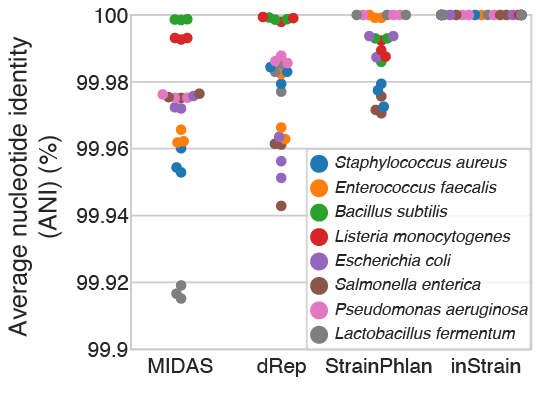
MIDAS, dRep, StrainPhlAn, and inStrain reported average ANI values of 99.97%, 99.98%, 99.990% and 99.999998%, respectively, with inStrain reporting average popANI values of 100% for 23 of the 24 comparisons and 99.99996% for one comparison. The difference in performance likely arises because the Zymo cultures contain non-fixed nucleotide variants that inStrain uses to confirm population overlap but that confuse the consensus sequences reported by dRep, StrainPhlAn, and MIDAS (conANI). We also used this data to establish a threshold for the detection of “same” versus “different” strains. The thresholds for MIDAS, dRep, StrainPhlAn, and inStrain, calculated based on the comparison with the lowest average ANI across all 24 sequence comparisons, are shown in the table below.
Program |
Minimum reported ANI |
Years divergence |
|---|---|---|
MIDAS |
99.92% |
3771 |
dRep |
99.94% |
2528 |
StrainPhlAn |
99.97% |
1307 |
InStrain |
99.99996% |
2.2 |
Years divergence was calculated from “minimum reported ANI” using the previously reported rate of 0.9 SNSs accumulated per genome per year in the gut microbiome of healthy human adults (Zhao 2019) . This benchmark demonstrates that inStrain can be used for detection of identical microbial strains with a stringency that is substantially higher than other tools. Stringent thresholds are useful for strain tracking, as strains that have diverged for hundreds to thousands of years are clearly not linked by a recent transmission event.
We also performed an additional benchmark with this data on inStrain only. InStrain relies on representative genomes to calculate popANI, so we wanted to know whether using non-ideal reference genomes would impact it’s accuracy. By mapping reads to all 4,644 representative genomes in the Unified Human Gastrointestinal Genome (UHGG) collection we identified the 8 relevant representative genomes. These genomes had between 93.9% - 99.6% ANI to the organisms present in the Zymo samples. InStrain comparisons based on these genomes were still highly accurate (average 99.9998% ANI, lowest 99.9995% ANI, limit of detection 32.2 years), highlighting that inStrain can be used with reference genomes from databases when sample-specific reference genomes cannot be assembled.
Methods for defined microbial community benchmark:
Reads from Zymo samples are available under BioProject PRJNA648136
For dRep, reads from each sample were assembled independently using IDBA_UD, binned into genomes based off of alignment to the provided reference genomes using nucmer, and compared using dRep on default settings.
For StrainPhlAn, reads from Zymo samples profiled with Metaphlan2, resulting marker genes were aligned using StrainPhlan, and the ANI of resulting nucleotide alignments was calculated as described in the synthetic benchmark above.
For MIDAS, reads from Zymo samples were provided to MIDAS directly and the ANI of sample comparisons was calculated as described in the synthetic benchmark above.
For inStrain, reads from Zymo samples were aligned to the provided reference genomes using Bowtie 2, profiled using “inStrain profile” under default settings, and compared using “inStrain compare” under default settings. popANI values were used for inStrain.
Eukaryotic genomes were excluded from this analysis, and raw values are available in Supplemental Table S1 of the inStrain manuscript. To evaluate inStrain when using genomes from public databases, all reference genomes from the UHGG collection were downloaded and concatenated into a single .fasta file. Reads from the Zymo sample were mapped against this database and processed with inStrain as described above. The ability of each method to detect genomes was performed using all Zymo reads concatenated together.
Benchmark with true microbial communities
This test evaluated the stringency with which each tool can detect shared strains in genuine microbial communities. Tests like this are hard to perform because it is difficult to know the ground truth. We can never really know whether two true genuine communities actually share strains. For this test we leveraged the fact that new-born siblings share far more strains than unrelated newborns.. In this test, we compared the ability of the programs to detect strains shared by twin premature infants (presumably True Positives) vs. their detection of strains shared by unrelated infants (presumably False Positives).
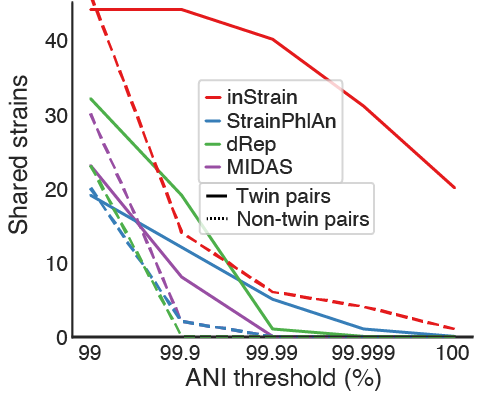
All methods identified significantly more strain sharing among twin pairs than pairs of unrelated infants, as expected, and inStrain remained sensitive at substantially higher ANI thresholds than the other tools. The reduced ability of StrainPhlAn and MIDAS to identify shared strains is likely based on their reliance on consensus-based ANI (conANI) measurements. We know that microbiomes can contain multiple coexisting strains, and when two or more strains of a species are in a sample at similar abundance levels it can lead to pileups of reads from multiple strains and chimeric sequences. The popANI metric is designed to account for this complexity.
It is also worth discussing Supplemental Figure S5 from the inStrain manuscript here.
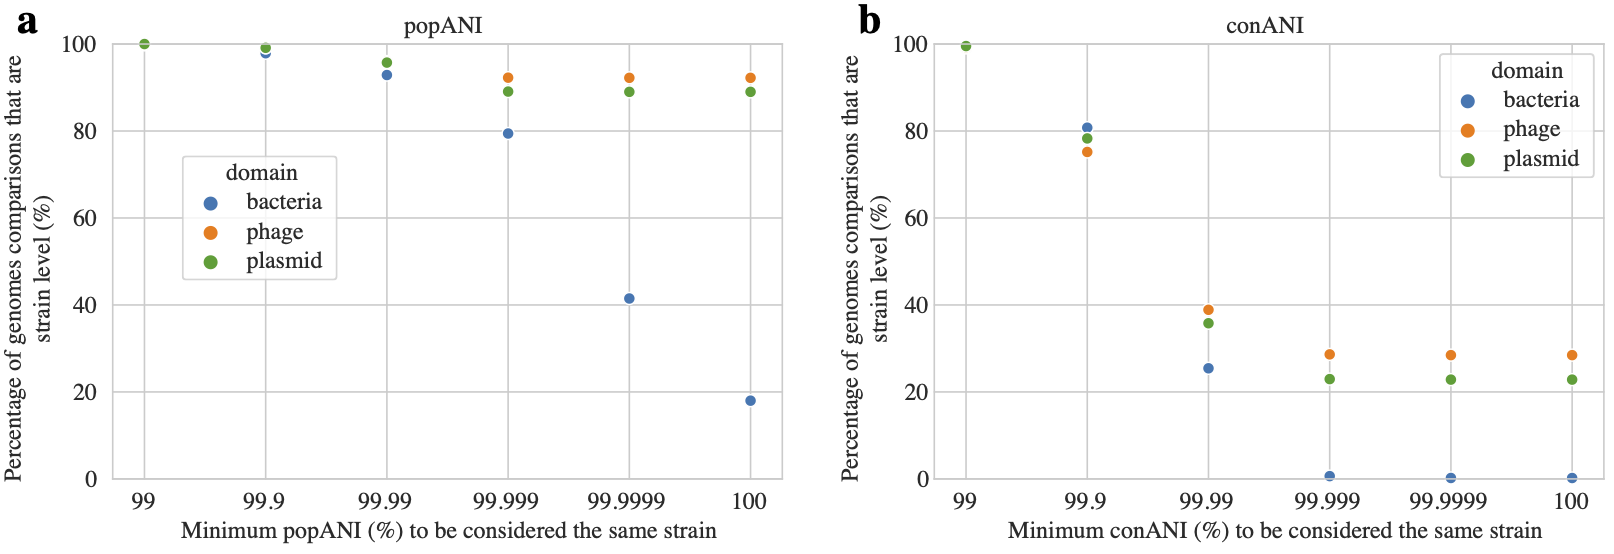
This figure was generated from genomic comparisons between genomes present in the same infant over time (longitudinal data). In cases where the same genome was detected in multiple time-points over the time-series sampling of an infant, the percentage of comparisons between genomes that exceed various popANI (a) and conANI (b) thresholds is plotted. This figure shows that the use of popANI allows greater stringency than conANI.
Note
Based on the data presented in the above tests, a threshold of 99.999% popANI was chosen as the threshold to define bacterial, bacteriophage, and plasmid strains for the work presented in the inStrain manuscript. This is likely a good threshold for a variety of communities.
Methods for true microbial community benchmark:
Twin-based comparisons were performed on three randomly chosen sets of twins that were sequenced during a previous study (Olm 2019). Reads can be found under Bioproject PRJNA294605
For StrainPhlAn, all reads sequenced from each infant were concatenated and profiled using Metaphlan2, compared using StrainPhlAn, and the ANI of resulting nucleotide alignments was calculated as described for the synthetic benchmark.
For MIDAS, all reads sequenced from each infant were concatenated and profiled with MIDAS, and the ANI of species profiled in multiple infants was calculated as described for the synthetic benchmark.
For dRep, all de-replicated bacterial genomes assembled and binned from each infant (available from (Olm 2019)) were compared in a pairwise manner using dRep under default settings.
For inStain, strain-sharing from these six infants was determined using the methods described below.
ANI values from all compared genomes and the number of genomes shared at a number of ANI thresholds are available for all methods in Supplemental Table S1 of the inStrain publication.
Species-level community profiling
This section contains tests evaluating the ability of inStrain and other tools to accurately profile microbial communities. Here inStrain is benchmarked against two other tools:
MIDAS - an integrated pipeline to estimate bacterial species abundance and strain-level genomic variation.
MetaPhlAn 2 - a computational tool for profiling the composition of microbial communities from metagenomic shotgun sequencing data. MetaPhlAn 2 uses unique clade-specific marker genes.
Benchmark with defined microbial communities
This test evaluated the ability of programs to identify the microbial species present in metagenomes of defined bacterial communities. For this test we purchased, extracted DNA from, and sequenced a ZymoBIOMICS Microbial Community Standard. The reads used for this test are available here. This community contains 8 defined bacterial species, and we simply evaluated the ability of each program to identify those and only those 8 bacterial species. Results in the table below.
Program |
True species detected |
False species detected |
Accuracy |
|---|---|---|---|
MIDAS |
8 |
15 |
35% |
MetaPhlAn 2 |
8 |
11 |
42% |
InStrain |
8 |
0 |
100% |
All programs successfully identified the 8 bacteria present in the metagenome, but MIDAS and StrainPhlAn detected an additional 15 and 11 bacterial species as well. The raw tables produced by each tool are available at the bottom of this section. Looking at these tables, you’ll notice that many of these False positive species detected are related to species that are actually present in the community. For example, MetaPhlAn2 reported the detection of Bacillus cereus thuringiensis (False Positive) as well as the detection of Bacillus subtilis (True Positive). Similarly, MIDAS reported the detection of Escherichia fergusonii (related to True Positive Escherichia coli) and Bacillus anthracis (related to True Positive Bacillus subtilis).
Importantly inStrain detected many of these same False Positives as well. However inStrain also provides a set of other metrics that properly filter out erroneous detections. Taking a look at the information reported by inStrain (at the very bottom of this page) shows that many genomes besides the 8 True Positives were detected. When using the recommended genome breadth cutoff of 50%, only the 8 True Positive genomes remain (see section “Detecting organisms in metagenomic data” in Important concepts for more info). You’ll notice that no such info is reported with MIDAS or MetaPhlAn 2. While relative abundance could conceivably be used to filter out erroneous taxa with these tools, doing so would majorly limit their ability to detect genuine low-abundance taxa.
It’s also worth noting that if one is just interested in measuring community presence / absence, as in this test, any program that accurately reports breadth should give similar results to inStrain when mapped against the UHGG genome set. One such program is coverM, a fast program for calculating genome coverage and breadth that can be run on its own or through inStrain using the command inStrain quick_profile.
Methods for defined microbial community profiling experiment:
For inStrain, all reference genomes from the UHGG collection were downloaded and concatenated into a single .fasta file, reads from the Zymo sample were mapped against this database, and inStrain profile was run on default settings.
Note
The UHGG genome database used for this section is available for download in the Tutorial section.
For MIDAS, the command run_midas.py species was used along with the default database. In cases where the same species was detected multiple times as part of multiple genomes, the species was only counted once.
For MetaPhlAn 2, the command metaphlan2.py was used along with the MetaPhlAn2 db_v20 database.
Eukaryotic genomes were excluded from this analysis.
Raw data for defined microbial community profiling experiment:
MetaPhlAn 2:
species |
abundance |
Metaphlan2_species |
Lactobacillus fermentum |
23.1133 |
k__Bacteria|p__Firmicutes|c__Bacilli|o__Lactobacillales|f__Lactobacillaceae|g__Lactobacillus|s__Lactobacillus_fermentum |
Escherichia coli |
20.0587 |
k__Bacteria|p__Proteobacteria|c__Gammaproteobacteria|o__Enterobacteriales|f__Enterobacteriaceae|g__Escherichia|s__Escherichia_coli |
Salmonella enterica |
18.44954 |
k__Bacteria|p__Proteobacteria|c__Gammaproteobacteria|o__Enterobacteriales|f__Enterobacteriaceae|g__Salmonella|s__Salmonella_enterica |
Pseudomonas aeruginosa |
14.42109 |
k__Bacteria|p__Proteobacteria|c__Gammaproteobacteria|o__Pseudomonadales|f__Pseudomonadaceae|g__Pseudomonas|s__Pseudomonas_aeruginosa |
Enterococcus faecalis |
12.21137 |
k__Bacteria|p__Firmicutes|c__Bacilli|o__Lactobacillales|f__Enterococcaceae|g__Enterococcus|s__Enterococcus_faecalis |
Staphylococcus aureus |
6.36267 |
k__Bacteria|p__Firmicutes|c__Bacilli|o__Bacillales|f__Staphylococcaceae|g__Staphylococcus|s__Staphylococcus_aureus |
Bacillus subtilis |
2.44228 |
k__Bacteria|p__Firmicutes|c__Bacilli|o__Bacillales|f__Bacillaceae|g__Bacillus|s__Bacillus_subtilis |
Listeria monocytogenes |
1.8644 |
k__Bacteria|p__Firmicutes|c__Bacilli|o__Bacillales|f__Listeriaceae|g__Listeria|s__Listeria_monocytogenes |
Salmonella unclassified |
0.67363 |
k__Bacteria|p__Proteobacteria|c__Gammaproteobacteria|o__Enterobacteriales|f__Enterobacteriaceae|g__Salmonella|s__Salmonella_unclassified |
Saccharomyces cerevisiae |
0.20426 |
k__Eukaryota|p__Ascomycota|c__Saccharomycetes|o__Saccharomycetales|f__Saccharomycetaceae|g__Saccharomyces|s__Saccharomyces_cerevisiae |
Cryptococcus neoformans |
0.05417 |
k__Eukaryota|p__Basidiomycota|c__Tremellomycetes|o__Tremellales|f__Tremellaceae|g__Filobasidiella|s__Cryptococcus_neoformans |
Listeria unclassified |
0.02341 |
k__Bacteria|p__Firmicutes|c__Bacilli|o__Bacillales|f__Listeriaceae|g__Listeria|s__Listeria_unclassified |
Klebsiella oxytoca |
0.0165 |
k__Bacteria|p__Proteobacteria|c__Gammaproteobacteria|o__Enterobacteriales|f__Enterobacteriaceae|g__Klebsiella|s__Klebsiella_oxytoca |
Naumovozyma unclassified |
0.01337 |
k__Eukaryota|p__Ascomycota|c__Saccharomycetes|o__Saccharomycetales|f__Saccharomycetaceae|g__Naumovozyma|s__Naumovozyma_unclassified |
Klebsiella unclassified |
0.01307 |
k__Bacteria|p__Proteobacteria|c__Gammaproteobacteria|o__Enterobacteriales|f__Enterobacteriaceae|g__Klebsiella|s__Klebsiella_unclassified |
Bacillus cereus thuringiensis |
0.00809 |
k__Bacteria|p__Firmicutes|c__Bacilli|o__Bacillales|f__Bacillaceae|g__Bacillus|s__Bacillus_cereus_thuringiensis |
Clostridium perfringens |
0.00554 |
k__Bacteria|p__Firmicutes|c__Clostridia|o__Clostridiales|f__Clostridiaceae|g__Clostridium|s__Clostridium_perfringens |
Eremothecium unclassified |
0.00319 |
k__Eukaryota|p__Ascomycota|c__Saccharomycetes|o__Saccharomycetales|f__Saccharomycetaceae|g__Eremothecium|s__Eremothecium_unclassified |
Veillonella parvula |
0.0015 |
k__Bacteria|p__Firmicutes|c__Negativicutes|o__Selenomonadales|f__Veillonellaceae|g__Veillonella|s__Veillonella_parvula |
Clostridium butyricum |
0.00054 |
k__Bacteria|p__Firmicutes|c__Clostridia|o__Clostridiales|f__Clostridiaceae|g__Clostridium|s__Clostridium_butyricum |
Enterobacter cloacae |
0.00051 |
k__Bacteria|p__Proteobacteria|c__Gammaproteobacteria|o__Enterobacteriales|f__Enterobacteriaceae|g__Enterobacter|s__Enterobacter_cloacae |
MIDAS:
species_id |
count_reads |
coverage |
relative_abundance |
species |
Lactobacillus_fermentum_54035 |
22305 |
322.661072 |
0.202032 |
Lactobacillus fermentum |
Salmonella_enterica_58156 |
18045 |
296.117276 |
0.185412 |
Salmonella enterica |
Escherichia_coli_58110 |
19262 |
286.702733 |
0.179517 |
Escherichia coli |
Pseudomonas_aeruginosa_57148 |
14214 |
214.266462 |
0.134162 |
Pseudomonas aeruginosa |
Enterococcus_faecalis_56297 |
12382 |
183.37939 |
0.114822 |
Enterococcus faecalis |
Staphylococcus_aureus_56630 |
6146 |
89.116402 |
0.0558 |
Staphylococcus aureus |
Bacillus_subtilis_57806 |
3029 |
44.275375 |
0.027723 |
Bacillus subtilis |
Salmonella_enterica_58266 |
3027 |
41.774295 |
0.026157 |
Salmonella enterica |
Listeria_monocytogenes_53478 |
2250 |
33.367947 |
0.020893 |
Listeria monocytogenes |
Escherichia_fergusonii_56914 |
2361 |
33.034998 |
0.020685 |
Escherichia fergusonii |
Pseudomonas_aeruginosa_55861 |
927 |
12.402473 |
0.007766 |
Pseudomonas aeruginosa |
Salmonella_enterica_53987 |
791 |
10.982231 |
0.006876 |
Salmonella enterica |
Escherichia_coli_57907 |
713 |
9.860496 |
0.006174 |
Escherichia coli |
Escherichia_albertii_56276 |
457 |
6.543769 |
0.004097 |
Escherichia albertii |
Citrobacter_youngae_61659 |
455 |
6.248948 |
0.003913 |
Citrobacter youngae |
Salmonella_bongori_55351 |
314 |
4.187424 |
0.002622 |
Salmonella bongori |
Staphylococcus_aureus_37016 |
62 |
0.907418 |
0.000568 |
Staphylococcus aureus |
Klebsiella_oxytoca_54123 |
29 |
0.418764 |
0.000262 |
Klebsiella oxytoca |
Bacillus_sp_58480 |
17 |
0.233451 |
0.000146 |
Bacillus sp |
Clostridium_perfringens_56840 |
12 |
0.182686 |
0.000114 |
Clostridium perfringens |
Listeria_monocytogenes_56337 |
11 |
0.162597 |
0.000102 |
Listeria monocytogenes |
Bacillus_subtilis_55718 |
9 |
0.127828 |
0.00008 |
Bacillus subtilis |
Bacillus_anthracis_57688 |
2 |
0.031576 |
0.00002 |
Bacillus anthracis |
Bacillus_cereus_58113 |
1 |
0.014684 |
0.000009 |
Bacillus cereus |
Enterococcus_faecium_56947 |
1 |
0.014791 |
0.000009 |
Enterococcus faecium |
Klebsiella_pneumoniae_54788 |
1 |
0.014852 |
0.000009 |
Klebsiella pneumoniae |
Veillonella_parvula_57794 |
1 |
0.014925 |
0.000009 |
Veillonella parvula |
Haemophilus_haemolyticus_58350 |
1 |
0.01351 |
0.000008 |
Haemophilus haemolyticus |
Veillonella_parvula_58184 |
1 |
0.012646 |
0.000008 |
Veillonella parvula |
Enterobacter_sp_59441 |
1 |
0.003478 |
0.000002 |
Enterobacter sp |
Pseudomonas_sp_59807 |
1 |
0.003203 |
0.000002 |
Pseudomonas sp |
InStrain:
genome |
species |
breadth |
relative_abundance |
coverage |
nucl_diversity |
length |
true_scaffolds |
detected_scaffolds |
coverage_median |
coverage_std |
coverage_SEM |
breadth_minCov |
breadth_expected |
nucl_diversity_rarefied |
conANI_reference |
popANI_reference |
iRep |
iRep_GC_corrected |
linked_SNV_count |
SNV_distance_mean |
r2_mean |
d_prime_mean |
consensus_divergent_sites |
population_divergent_sites |
SNS_count |
SNV_count |
filtered_read_pair_count |
reads_unfiltered_pairs |
reads_mean_PID |
reads_unfiltered_reads |
divergent_site_count |
Genome |
lineage |
genus |
GUT_GENOME142031.fna.gz |
Salmonella enterica |
0.890900711 |
0.192920699 |
418.6273152 |
0.001575425 |
4955431 |
2 |
1 |
470 |
167.6327653 |
0.075307073 |
0.889570251 |
1 |
0.0012784 |
0.988936764 |
0.989338515 |
FALSE |
29019 |
66.11144423 |
0.579492141 |
0.962855588 |
48769 |
46998 |
46575 |
5776 |
7448284 |
7508196 |
0.988009952 |
15332041 |
52351 |
GUT_GENOME142031 |
d__Bacteria;p__Proteobacteria;c__Gammaproteobacteria;o__Enterobacterales;f__Enterobacteriaceae;g__Salmonella;s__Salmonella enterica |
Salmonella |
|
GUT_GENOME143383.fna.gz |
Pseudomonas aeruginosa |
0.894646033 |
0.176078828 |
280.4839772 |
0.001768407 |
6750396 |
80 |
74 |
312 |
110.1119447 |
0.042431183 |
0.892788808 |
1 |
0.001509706 |
0.99020306 |
0.990485637 |
FALSE |
38085 |
95.96318761 |
0.622403987 |
0.959864075 |
59043 |
57340 |
56922 |
6330 |
6780948 |
6815597 |
0.985681579 |
13897895 |
63252 |
GUT_GENOME143383 |
d__Bacteria;p__Proteobacteria;c__Gammaproteobacteria;o__Pseudomonadales;f__Pseudomonadaceae;g__Pseudomonas;s__Pseudomonas aeruginosa |
Pseudomonas |
|
GUT_GENOME144544.fna.gz |
Escherichia coli |
0.777878058 |
0.138653747 |
279.2311026 |
0.001677588 |
5339468 |
2 |
2 |
358 |
191.117164 |
0.082711711 |
0.772478831 |
1 |
0.001249049 |
0.976197599 |
0.976755468 |
FALSE |
38443 |
87.25424655 |
0.594190893 |
0.979230955 |
98176 |
95875 |
95304 |
7777 |
5341780 |
5396883 |
0.949021155 |
11455710 |
103081 |
GUT_GENOME144544 |
d__Bacteria;p__Proteobacteria;c__Gammaproteobacteria;o__Enterobacterales;f__Enterobacteriaceae;g__Escherichia;s__Escherichia coli_D |
Escherichia |
|
GUT_GENOME000862.fna.gz |
Lactobacillus fermentum |
0.862275194 |
0.096747331 |
528.5687445 |
0.002324426 |
1968193 |
80 |
71 |
512 |
531.1341113 |
0.380139439 |
0.861009566 |
1 |
0.001853701 |
0.992704615 |
0.99333307 |
FALSE |
24523 |
43.65012437 |
0.472475022 |
0.941868743 |
12363 |
11298 |
10943 |
4409 |
3897780 |
3915245 |
0.987724733 |
8141064 |
15352 |
GUT_GENOME000862 |
d__Bacteria;p__Firmicutes;c__Bacilli;o__Lactobacillales;f__Lactobacillaceae;g__Lactobacillus_H;s__Lactobacillus_H fermentum |
Lactobacillus_H |
|
GUT_GENOME103721.fna.gz |
Enterococcus faecalis |
0.890365837 |
0.064796999 |
247.8988054 |
0.001359966 |
2810675 |
1 |
1 |
263 |
106.7589636 |
0.063681687 |
0.889176088 |
1 |
0.001009117 |
0.992572379 |
0.992928895 |
FALSE |
16206 |
70.9866099 |
0.521939243 |
0.942993799 |
18563 |
17672 |
17443 |
3088 |
2521061 |
2542269 |
0.991283432 |
5173192 |
20531 |
GUT_GENOME103721 |
d__Bacteria;p__Firmicutes;c__Bacilli;o__Lactobacillales;f__Enterococcaceae;g__Enterococcus;s__Enterococcus faecalis |
Enterococcus |
|
GUT_GENOME141183.fna.gz |
Staphylococcus aureus |
0.941567947 |
0.03353288 |
131.1378903 |
0.001375635 |
2749621 |
2 |
2 |
142 |
41.45182417 |
0.024999936 |
0.93883157 |
1 |
0.000914462 |
0.99279082 |
0.993222751 |
FALSE |
22344 |
72.09188149 |
0.540395915 |
0.915284188 |
18610 |
17495 |
17253 |
4097 |
1305000 |
1316045 |
0.959624337 |
2691675 |
21350 |
GUT_GENOME141183 |
d__Bacteria;p__Firmicutes;c__Bacilli;o__Staphylococcales;f__Staphylococcaceae;g__Staphylococcus;s__Staphylococcus aureus |
Staphylococcus |
|
GUT_GENOME145983.fna.gz |
Escherichia fergusonii |
0.336139906 |
0.013061031 |
30.24324694 |
0.001418115 |
4643861 |
2 |
1 |
0 |
73.62873041 |
0.034168543 |
0.286148746 |
1 |
0.00110964 |
0.96878243 |
0.969196326 |
FALSE |
5682 |
86.23970433 |
0.70271658 |
0.99040633 |
41483 |
40933 |
40787 |
1849 |
507148 |
517498 |
0.971752174 |
1312986 |
42636 |
GUT_GENOME145983 |
d__Bacteria;p__Proteobacteria;c__Gammaproteobacteria;o__Enterobacterales;f__Enterobacteriaceae;g__Escherichia;s__Escherichia fergusonii |
Escherichia |
|
GUT_GENOME141005.fna.gz |
Listeria monocytogenes |
0.924613578 |
0.012249816 |
43.6464116 |
0.000913049 |
3017944 |
1 |
1 |
47 |
15.93616519 |
0.009173661 |
0.920719868 |
1 |
0.000838075 |
0.995876101 |
0.995969311 |
FALSE |
4390 |
69.92277904 |
0.693771377 |
0.988098539 |
11459 |
11200 |
11171 |
1341 |
475888 |
477867 |
0.994961092 |
980123 |
12512 |
GUT_GENOME141005 |
d__Bacteria;p__Firmicutes;c__Bacilli;o__Lactobacillales;f__Listeriaceae;g__Listeria;s__Listeria monocytogenes_B |
Listeria |
|
GUT_GENOME000031.fna.gz |
Bacillus subtilis |
0.796819131 |
0.011738601 |
31.12210212 |
0.00098138 |
4055810 |
14 |
13 |
28 |
32.20366662 |
0.015996189 |
0.729697397 |
1 |
0.000859228 |
0.939115003 |
0.93935457 |
FALSE |
1163 |
21.13241617 |
0.702766252 |
0.973300401 |
180190 |
179481 |
179281 |
2155 |
454156 |
593524 |
0.940236231 |
1292915 |
181436 |
GUT_GENOME000031 |
d__Bacteria;p__Firmicutes;c__Bacilli;o__Bacillales;f__Bacillaceae;g__Bacillus;s__Bacillus subtilis |
Bacillus |
|
GUT_GENOME140826.fna.gz |
Escherichia sp000208585 |
0.278930014 |
0.007440286 |
17.72017163 |
0.001540747 |
4514939 |
29 |
17 |
0 |
56.92691685 |
0.0268084 |
0.206155831 |
0.99999984 |
0.001388545 |
0.967896852 |
0.968409325 |
FALSE |
5947 |
105.5668404 |
0.766140483 |
0.983050761 |
29881 |
29404 |
29302 |
1691 |
290320 |
305163 |
0.960887088 |
820252 |
30993 |
GUT_GENOME140826 |
d__Bacteria;p__Proteobacteria;c__Gammaproteobacteria;o__Enterobacterales;f__Enterobacteriaceae;g__Escherichia;s__Escherichia sp000208585 |
Escherichia |
|
GUT_GENOME145378.fna.gz |
Escherichia albertii |
0.122179339 |
0.003167813 |
6.860465646 |
0.00235464 |
4965193 |
164 |
83 |
0 |
39.5967056 |
0.017829135 |
0.081533789 |
0.997660437 |
0.00218204 |
0.961660545 |
0.962826463 |
FALSE |
12166 |
157.8004274 |
0.794119571 |
0.973439113 |
15521 |
15049 |
14939 |
1495 |
123735 |
140151 |
0.953424167 |
407112 |
16434 |
GUT_GENOME145378 |
d__Bacteria;p__Proteobacteria;c__Gammaproteobacteria;o__Enterobacterales;f__Enterobacteriaceae;g__Escherichia;s__Escherichia albertii |
Escherichia |
|
GUT_GENOME143726.fna.gz |
Salmonella bongori |
0.070875018 |
0.003160648 |
7.43337583 |
0.001600002 |
4572147 |
84 |
48 |
0 |
96.31442795 |
0.045126398 |
0.038681827 |
0.998589302 |
0.001128128 |
0.972543099 |
0.973068942 |
FALSE |
552 |
38.54710145 |
0.364521691 |
0.826322255 |
4856 |
4763 |
4731 |
305 |
122896 |
130428 |
0.968771686 |
341983 |
5036 |
GUT_GENOME143726 |
d__Bacteria;p__Proteobacteria;c__Gammaproteobacteria;o__Enterobacterales;f__Enterobacteriaceae;g__Salmonella;s__Salmonella bongori |
Salmonella |
|
GUT_GENOME140808.fna.gz |
Escherichia marmotae |
0.120972135 |
0.002155978 |
5.167057447 |
0.001726413 |
4486744 |
47 |
38 |
0 |
33.4691403 |
0.015817374 |
0.074067966 |
0.989564186 |
0.001588357 |
0.965091296 |
0.965708164 |
FALSE |
2054 |
74.47565725 |
0.741056343 |
0.989146608 |
11601 |
11396 |
11330 |
792 |
84663 |
96297 |
0.955863071 |
277452 |
12122 |
GUT_GENOME140808 |
d__Bacteria;p__Proteobacteria;c__Gammaproteobacteria;o__Enterobacterales;f__Enterobacteriaceae;g__Escherichia;s__Escherichia marmotae |
Escherichia |
|
GUT_GENOME142492.fna.gz |
Listeria monocytogenes |
0.126213955 |
0.001176886 |
4.302069537 |
0.001059694 |
2941624 |
14 |
11 |
0 |
34.20030999 |
0.01995002 |
0.059155079 |
0.977600741 |
0.000372324 |
0.982937958 |
0.983231042 |
FALSE |
206 |
9.058252427 |
0.844509747 |
1 |
2969 |
2918 |
2910 |
151 |
45956 |
47236 |
0.983439086 |
109110 |
3061 |
GUT_GENOME142492 |
d__Bacteria;p__Firmicutes;c__Bacilli;o__Lactobacillales;f__Listeriaceae;g__Listeria;s__Listeria monocytogenes |
Listeria |
|
GUT_GENOME146010.fna.gz |
Metakosakonia intermedia |
0.011269041 |
0.0007257 |
1.265470484 |
0.001803324 |
6166452 |
5 |
4 |
0 |
20.17351043 |
0.008124545 |
0.0086103 |
0.672874189 |
0.001151362 |
0.987399943 |
0.988096808 |
FALSE |
68 |
6.632352941 |
0.519849079 |
0.971330957 |
669 |
632 |
623 |
100 |
28027 |
28249 |
0.990376613 |
65337 |
723 |
GUT_GENOME146010 |
d__Bacteria;p__Proteobacteria;c__Gammaproteobacteria;o__Enterobacterales;f__Enterobacteriaceae;g__Metakosakonia;s__Metakosakonia intermedia |
Metakosakonia |
|
GUT_GENOME143527.fna.gz |
Cronobacter malonaticus |
0.0056892 |
0.000591325 |
1.422193205 |
0.001895836 |
4470927 |
309 |
24 |
0 |
24.52026825 |
0.011677475 |
0.004481621 |
0.715151153 |
0.000863784 |
0.991316065 |
0.99186505 |
FALSE |
43 |
3.348837209 |
0.323536849 |
0.895980567 |
174 |
163 |
157 |
52 |
22952 |
23584 |
0.95668831 |
51969 |
209 |
GUT_GENOME143527 |
d__Bacteria;p__Proteobacteria;c__Gammaproteobacteria;o__Enterobacterales;f__Enterobacteriaceae;g__Cronobacter;s__Cronobacter malonaticus |
Cronobacter |
|
GUT_GENOME147796.fna.gz |
Staphylococcus argenteus |
0.072414548 |
0.000549275 |
2.122002981 |
0.002476746 |
2783391 |
89 |
66 |
0 |
13.35139068 |
0.008028467 |
0.046540353 |
0.846449939 |
0.001206762 |
0.96824147 |
0.969777675 |
FALSE |
1626 |
68.76383764 |
0.880724477 |
0.994276953 |
4114 |
3915 |
3871 |
560 |
21703 |
24408 |
0.955482052 |
67154 |
4431 |
GUT_GENOME147796 |
d__Bacteria;p__Firmicutes;c__Bacilli;o__Staphylococcales;f__Staphylococcaceae;g__Staphylococcus;s__Staphylococcus argenteus |
Staphylococcus |
|
GUT_GENOME095995.fna.gz |
Citrobacter portucalensis_A |
0.009471768 |
0.000474738 |
0.990436461 |
0.001709209 |
5154159 |
10 |
8 |
0 |
19.06540862 |
0.008399463 |
0.005825781 |
0.5829526 |
0.001430662 |
0.953575116 |
0.954008059 |
FALSE |
36 |
67.25 |
0.565195465 |
1 |
1394 |
1381 |
1381 |
49 |
18414 |
20414 |
0.952624755 |
48144 |
1430 |
GUT_GENOME095995 |
d__Bacteria;p__Proteobacteria;c__Gammaproteobacteria;o__Enterobacterales;f__Enterobacteriaceae;g__Citrobacter;s__Citrobacter portucalensis_A |
Citrobacter |
|
GUT_GENOME000024.fna.gz |
Lactobacillus_B murinus |
0.001870138 |
0.000441384 |
2.136753757 |
0.014148006 |
2221226 |
144 |
7 |
0 |
107.2864275 |
0.072457344 |
0.001074182 |
0.84843695 |
0.009892552 |
0.959346186 |
0.964375524 |
FALSE |
542 |
135.7435424 |
0.169030486 |
0.84185153 |
97 |
85 |
84 |
72 |
17418 |
17595 |
0.941170306 |
40278 |
156 |
GUT_GENOME000024 |
d__Bacteria;p__Firmicutes;c__Bacilli;o__Lactobacillales;f__Lactobacillaceae;g__Lactobacillus_B;s__Lactobacillus_B murinus |
Lactobacillus_B |
|
GUT_GENOME078306.fna.gz |
Lactobacillus_H oris |
0.001220271 |
0.000399444 |
2.141072453 |
0.012295828 |
2006111 |
94 |
4 |
0 |
77.23755615 |
0.054789295 |
0.000866353 |
0.849013821 |
0.010541041 |
0.995972382 |
0.998849252 |
FALSE |
398 |
16.92713568 |
0.302731013 |
0.826865848 |
7 |
2 |
2 |
40 |
16099 |
16158 |
0.936115413 |
38348 |
42 |
GUT_GENOME078306 |
d__Bacteria;p__Firmicutes;c__Bacilli;o__Lactobacillales;f__Lactobacillaceae;g__Lactobacillus_H;s__Lactobacillus_H oris |
Lactobacillus_H |
|
GUT_GENOME225144.fna.gz |
0.009928145 |
0.000347535 |
1.549658971 |
0.002163833 |
2411528 |
1340 |
22 |
0 |
23.45474186 |
0.016020135 |
0.009063133 |
0.745473131 |
0.000727385 |
0.979730966 |
0.980646047 |
FALSE |
66 |
3.333333333 |
0.700603722 |
0.963204482 |
443 |
423 |
414 |
70 |
13562 |
13757 |
0.97127631 |
33858 |
484 |
GUT_GENOME225144 |
d__Bacteria;p__Firmicutes_A;c__Clostridia;o__Lachnospirales;f__Lachnospiraceae;g__Faecalicatena;s__ |
Faecalicatena |
||
GUT_GENOME038289.fna.gz |
0.00099285 |
0.000296215 |
1.742384732 |
0.010683495 |
1828071 |
235 |
2 |
0 |
74.35939765 |
0.055717981 |
0.000973157 |
0.785302607 |
0.008367741 |
0.983136594 |
0.988757729 |
FALSE |
240 |
68.54166667 |
0.330322272 |
0.915762753 |
30 |
20 |
20 |
36 |
11886 |
11920 |
0.982379242 |
28904 |
56 |
GUT_GENOME038289 |
d__Bacteria;p__Proteobacteria;c__Gammaproteobacteria;o__Enterobacterales;f__Pasteurellaceae;g__Haemophilus_D;s__ |
Haemophilus_D |
||
GUT_GENOME143493.fna.gz |
Lactobacillus_G kefiri |
0.00864699 |
0.000280612 |
1.173767593 |
0.006727598 |
2570721 |
10 |
3 |
0 |
19.31409016 |
0.0120508 |
0.007831655 |
0.645283636 |
0.005352071 |
0.992251527 |
0.995380718 |
FALSE |
1002 |
65.8992016 |
0.448661201 |
0.961561942 |
156 |
93 |
82 |
276 |
11319 |
11437 |
0.990954152 |
28111 |
358 |
GUT_GENOME143493 |
d__Bacteria;p__Firmicutes;c__Bacilli;o__Lactobacillales;f__Lactobacillaceae;g__Lactobacillus_G;s__Lactobacillus_G kefiri |
Lactobacillus_G |
|
GUT_GENOME212929.fna.gz |
0.004865114 |
0.000265953 |
1.504297544 |
0.006577654 |
1901086 |
52 |
12 |
0 |
31.30317094 |
0.022765581 |
0.004161306 |
0.735071349 |
0.003925862 |
0.982176716 |
0.986348123 |
FALSE |
730 |
96.23287671 |
0.844539753 |
0.995313875 |
141 |
108 |
99 |
114 |
10256 |
10633 |
0.958751213 |
27570 |
213 |
GUT_GENOME212929 |
d__Bacteria;p__Firmicutes_C;c__Negativicutes;o__Veillonellales;f__Veillonellaceae;g__F0422;s__ |
F0422 |
||
GUT_GENOME141398.fna.gz |
Lactobacillus crispatus |
0.001957446 |
0.000245098 |
1.440641732 |
0.016147943 |
1829425 |
63 |
3 |
0 |
38.97971904 |
0.028918934 |
0.001950886 |
0.719753764 |
0.01075873 |
0.985149902 |
0.995236761 |
FALSE |
919 |
85.0968444 |
0.532244527 |
0.953133466 |
53 |
17 |
15 |
120 |
9893 |
10121 |
0.984396172 |
25843 |
135 |
GUT_GENOME141398 |
d__Bacteria;p__Firmicutes;c__Bacilli;o__Lactobacillales;f__Lactobacillaceae;g__Lactobacillus;s__Lactobacillus crispatus |
Lactobacillus |
|
GUT_GENOME229203.fna.gz |
0.001076576 |
0.000237003 |
1.216154076 |
0.009783963 |
2095533 |
369 |
2 |
0 |
50.30343773 |
0.035378211 |
0.0010656 |
0.658314327 |
0.005923767 |
0.991939095 |
0.997313032 |
FALSE |
176 |
7.352272727 |
0.255200979 |
0.773989489 |
18 |
6 |
4 |
42 |
9197 |
9229 |
0.996035052 |
24260 |
46 |
GUT_GENOME229203 |
d__Bacteria;p__Bacteroidota;c__Bacteroidia;o__Bacteroidales;f__Bacteroidaceae;g__Prevotella;s__ |
Prevotella |
||
GUT_GENOME140701.fna.gz |
Lactobacillus_H mucosae |
0.006795042 |
0.00022553 |
1.023402847 |
0.003734144 |
2369669 |
12 |
9 |
0 |
18.31360326 |
0.011902826 |
0.005363618 |
0.594917575 |
0.001824337 |
0.959480724 |
0.960582219 |
FALSE |
154 |
89.28571429 |
0.726658579 |
0.984646084 |
515 |
501 |
493 |
83 |
9190 |
10224 |
0.968193502 |
25547 |
576 |
GUT_GENOME140701 |
d__Bacteria;p__Firmicutes;c__Bacilli;o__Lactobacillales;f__Lactobacillaceae;g__Lactobacillus_H;s__Lactobacillus_H mucosae |
Lactobacillus_H |
|
GUT_GENOME001416.fna.gz |
Vagococcus teuberi |
0.001203634 |
0.000195751 |
0.932135043 |
0.001248896 |
2258161 |
50 |
4 |
0 |
37.87233052 |
0.02525855 |
0.001052626 |
0.560920699 |
0.001109488 |
0.991165334 |
0.991586033 |
FALSE |
4 |
6.25 |
1 |
1 |
21 |
20 |
19 |
5 |
7731 |
7736 |
0.976960693 |
21662 |
24 |
GUT_GENOME001416 |
d__Bacteria;p__Firmicutes;c__Bacilli;o__Lactobacillales;f__Vagococcaceae;g__Vagococcus;s__Vagococcus teuberi |
Vagococcus |